Less pain at the pump: Oregon’s latest gas price drop is among the nation’s biggest, AAA says
KTVZ
PORTLAND, Ore. (KTVZ) – The Oregon average for a gallon of regular gas is back below $4 a gallon for the first time since early September, when the Olympic Pipeline went out of service, AAA Oregon/Idaho reported Tuesday.
Here’s AAA’s weekly report:
While drivers here are paying less for gas, the national average rose a few cents in the past week before falling again, after a refinery fire in the Midwest caused prices in that region to jump.
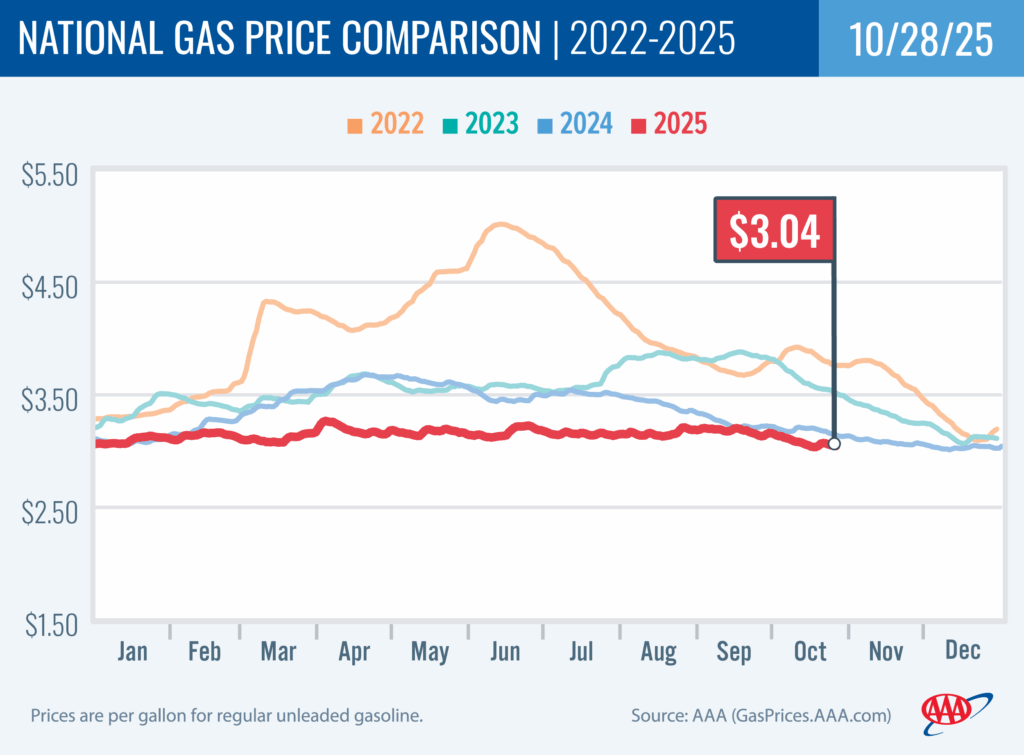
For the week, the national average for regular slips half a cent to $3.04 a gallon. The Oregon average tumbles eight cents to $3.94 a gallon, while Bend’s average falls about six cents to $3.77.
Oregon has the third-largest week-over-week drop for a state in the nation.

“The Oregon average for regular gas dipped below the $4 mark on October 22 for the first time since September 5. Gas prices in Oregon and Washington soared last month after an outage on the Olympic Pipeline, which brings fuel to Oregon from refineries in Washington State. Gas prices in this region have steadily declined since the pipeline reopened, and drivers should continue to get relief at the pumps, barring unforeseen events,” says Marie Dodds, public affairs director for AAA Oregon/Idaho.
The Oregon average for regular gas began 2025 at $3.45 a gallon and is currently at $3.94. The highest price of the year so far is $4.297 on September 13 and 14. The lowest price of the year so far is just under $3.45 a gallon on January 2.
The national average began 2025 at $3.06 a gallon and is currently at $3.04. The highest price of the year so far is $3.268 on April 4. The lowest price of the year so far is $3.036 on October 19 and 20.
This week, 12 Oregon counties have averages at or above $4, compared to 16 a week ago:
Clackamas $4.05
Columbia $4.06
Curry $4.04
Harney $4.03
Josephine $4.00
Multnomah $4.19
Sherman $4.03
Tillamook $4.04
Wallowa $4.13
Wasco $4.08
Washington $4.15
Yamhill $4.00
Demand for gasoline in the U.S. gasoline demand remained flat at 8.45 million b/d for the week ending October 17. This compares to 8.84 million b/d a year ago. Total domestic gasoline supply decreased from 218.8 million barrels to 216.7 million. Gasoline production increased last week, averaging 9.6 million barrels per day compared to 9.4 million barrels per day the previous week.
Gas prices usually drop in the fall, due to the switch from summer-blend to winter-blend fuel, which costs less to produce. The switch starts in September. Many areas, including Oregon, can sell winter-blend fuel starting September 15. However, Northern and Southern California require summer-blend fuel through October 31. Prices usually decline to their lowest levels of the year in late fall and early winter before increasing again in the late winter and early spring.
Gas prices typically rise starting in mid-to-late winter and early spring as refineries undergo maintenance ahead of the switch to summer-blend fuel, which is more expensive to produce and less likely to evaporate in warmer temperatures. The switch occurs first in California, which is why pump prices on the West Coast often rise before other parts of the country.
The East Coast is the last major market to switch to summer-blend fuel. Most areas have a May 1 compliance date for refiners and terminals, while most gas stations have a June 1 deadline to switch to selling summer-blend until June 1. Switch-over dates are earlier in California with some areas in the state requiring summer-blend fuel by April 1. Some refineries will begin maintenance and the switchover in February.
The U.S. price of crude oil (West Texas Intermediate) rose above $60 on October 23 for the first time since October 10 and has remained above $60 since then. Crude oil prices rose after President Trump imposed additional sanctions on Russian oil. In addition, this week’s trade talks between the U.S. and China is putting upward pressure on oil prices, offsetting some of the market concerns of a slowing global economy.
WTI has been mostly in the low-$60s to mid-$70s since September 2024. Crude prices spiked to the mid-$70s in mid-June in response to the strikes between Israel and Iran, and then the U.S. strike on Iran’s nuclear facilities, but then prices fell back into the $60s on the belief that the conflict would not have a major impact on global oil supplies.
Crude prices fell in early April as markets reacted to President Trumps tariffs and the impact on U.S. and global markets. Additional downward pressure on crude prices came after the decision by OPEC+ to increase production. The lowest closing price since September was $57.13 on May 5, which was the lowest closing price since February 2021. The recent high price for crude was $80.04 per barrel on January 15, which was the highest price since last August 2024.
Crude oil is trading around $60 today compared to $58 a week ago and $67 a year ago. In 2024, West Texas Intermediate ranged between $66 and $87 per barrel. In 2023, WTI ranged between $63 and $95 per barrel. WTI reached recent highs of $123.70 on March 8, 2022, shortly after the Russian invasion of Ukraine, and $122.11 per barrel on June 8, 2022. The all-time high for WTI crude oil is $147.27 in July 2008.
Crude prices are impacted by economic news as well as geopolitical events around the world including the current economic uncertainty, unrest in the Middle East, the war between Israel and Hamas, and the war between Russia and Ukraine. Russia is a top global oil producer, behind the U.S. and Saudi Arabia. Crude prices have been volatile after the attack on Israel by Hamas in October 2023.
While Israel and the Palestinian territory are not oil producers, there were concerns that the conflict could spread in the Middle East, which could potentially impact crude production in other oil-producing nations in the region.
Crude oil prices declined after this month’s fragile peace agreement between Israel and Hamas. In addition, production cuts by OPEC+ in previous years tightened global crude oil supplies, which continued to impact prices. But this year, the cartel has boosted production starting by 411,000 barrels per day in May, June, and July, 548,000 barrels per day in August, 547,000 barrels per day in September, and 137,000 barrels per day in October.
Crude oil is the main ingredient in gasoline and diesel, so pump prices are impacted by crude prices on the global markets. On average, about 51% of what we pay for in a gallon of gasoline is for the price of crude oil, 18% is refining, 16% distribution and marketing, and 16% are taxes, according to the U.S. Energy Information Administration.
Meanwhile, crude oil production in the U.S. remains near record highs. The U.S. Energy Information Administration (EIA) reports that crude production in his country dipped from the record high of 13.636 million barrels per day for the week of October 10 to 13.629 for the week ending October 17. The previous record high was 13.631 million barrels per day for the week of December 6, 2024. Production has been at 13.5 million barrels per day many times since October 2024.
The U.S. has been the top producer of crude oil in the world since 2018 and has been increasing its oil production since about 2009.
Quick stats
Oregon is one of 31 states with lower prices now than a week ago. Ohio (-14 cents) has the largest week-over-week decline in the nation. Oregon (-8 cents) has the third-largest week-over-week decline. Iowa (+13 cents) has the biggest week-over-week increase in the nation, due to a fire this month at the BP refinery in Whiting, Indiana which is the largest in the Midwest. The average in Hawaii is flat.
California ($4.58) is the state with the most expensive gas in the nation for the sixth week in a row. Washington took over the top spot for a week in September when the Olympic Pipeline was out of operation. This week, Hawaii ($4.48) is second, and Washington ($4.33) is third. These are the only states with averages at or above $4 a gallon. This week 16 states and the District of Columbia have averages in the $3-range. There are 31 states with an average in the $2 range this week.
The cheapest gas in the nation is in Mississippi ($2.59) and Louisiana ($2.60) and. No state has had an average below $2 a gallon since January 7, 2021, when Mississippi and Texas were below that threshold. At the time, the COVID-19 pandemic drove significant declines in crude oil and gasoline demand in the U.S. and around the world.
The difference between the most expensive and least expensive states is $1.99 this week, compared to $2.07 a week ago.
Oregon is one of 47 states and the District of Columbia with lower prices now than a month ago. The national average is nine cents less and the Oregon average is 26 cents less than a month ago. This is the largest month-over-month decline for a state in the nation. Michigan (+2 cents) has the largest month-over-month increase in the nation.
Oregon is one of seven states with higher prices now than a year ago. The national average is nine cents less, while the Oregon average is 30 cents more. Oregon has the largest year-over-year increase in the nation. Washington (+28 cents) has the second-largest increase. Colorado (-30 cents) has the largest yearly drop.
West Coast
The West Coast region continues to have the most expensive pump prices in the nation with all seven states in the top 10. It’s typical for the West Coast to have six or seven states in the top 10 as this region tends to consistently have fairly tight supplies, consuming about as much gasoline as is produced. In addition, this region is located relatively far from parts of the country where oil drilling, production and refining occurs, so transportation costs are higher. And environmental programs in this region add to the cost of production, storage and distribution.
Rank
Region
Price on 10/28/2025
1
California
$4.58
2
Hawaii
$4.48
3
Washington
$4.33
4
Oregon
$3.94
5
Alaska
$3.83
6
Nevada
$3.79
7
Idaho
$3.39
8
Arizona
$3.33
9
Utah
$3.26
10
Illinois
$3.24
As mentioned above, California is the state with the most expensive gas in the nation for the sixth week in a row. Hawaii, Washington, Oregon, Alaska, and Nevada round out the top six. Arizona is eighth. Oregon is fourth most expensive for the 23rd week in a row.
Six of the seven West Coast states have week-over-week decreases. Oregon (-8 cents) has the largest week-over-week decline in the region. Washington (-7 cents), Arizona (-6 cents), Nevada (-5 cents), California (-4 cents), and Alaska (-4 cents) also have weekly declines. The average in Hawaii is flat.
The refinery utilization rate on the West Coast slipped from 77.3% to 76.3% for the week ending October 17. This rate has ranged between about 72% to 93% in the last year. The latest national refinery utilization rate rose from 85.7% to 88.6%.
The refinery utilization rate measures how much crude oil refineries are processing as a percentage of their maximum capacity. A low or declining rate can put upward pressure on pump prices, while a high or rising rate can put downward pressure on pump prices.
According to EIA’s latest weekly report, total gas stocks in the region increased from 29.32 million bbl. to 29.51 million bbl. An increase in gasoline stocks can put downward pressure on pump prices, while a decrease in gasoline stocks can put upward pressure on pump prices.
Oil market dynamics
Crude oil prices have rebounded from the five-month lows seen earlier this month. WTI crude fell below $60 per barrel on Oct. 10, then rose above $60 on Oct. 23. Major drivers of higher crude prices include new U.S. sanctions on Russian oil and optimism that this week’s trade talks between the U.S. and China could bolster the global economy.
Meanwhile, the EIA reports that crude oil inventories decreased by 1 million barrels from the previous week. At 422.8 million barrels, U.S. crude oil inventories are about 4% below the five-year average for this time of year.
At the close of Friday’s formal trading session, WTI ticked down 29 cents to close at $61.50. At the close of Monday’s formal trading session, WTI slipped 19 cents to settle at $61.31. Today crude is trading around $60 compared to $58 a week ago. Crude prices are about $7 less than a year ago. ($67.38 on October 28, 2024)
Drivers can find current gas prices along their route with the free AAA Mobile app for iPhone, iPad and Android. The app can also be used to map a route, find discounts, book a hotel and access AAA roadside assistance. Learn more at AAA.com/mobile.
Diesel
For the week, the national average climbs five cents to $3.67 a gallon. The record high is $5.816 set on June 19, 2022. The Oregon average dips two cents to $4.39. The record high is $6.47 set on July 3, 2022. A year ago the national average for diesel was $3.57 and the Oregon average was $3.91.
Find current fuel prices at GasPrices.AAA.com.